

 Dr. Elena Vasquez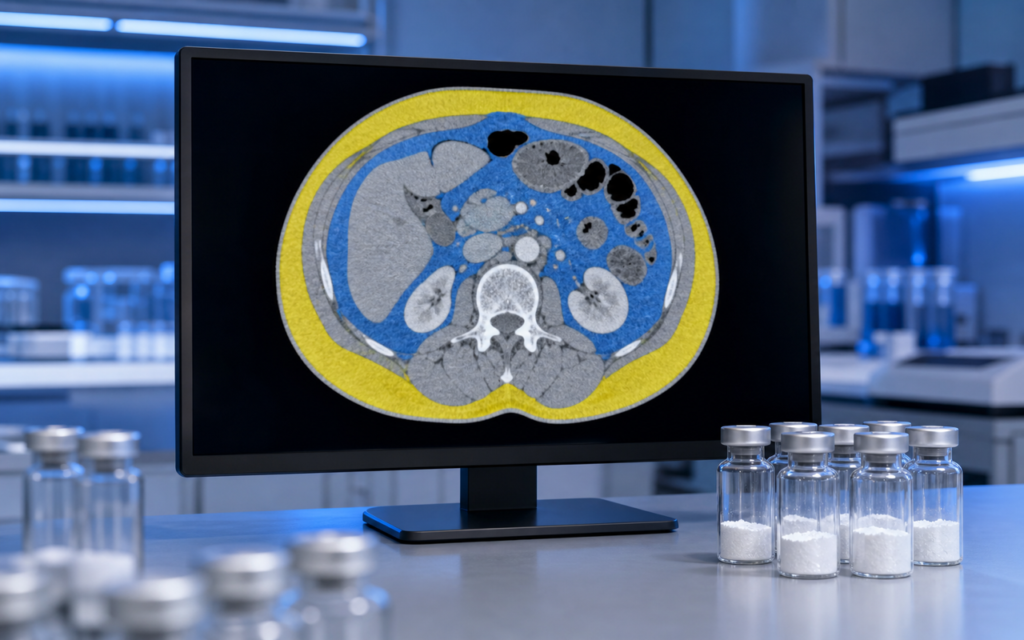

· For research use only. Not for human consumption.
The tesamorelin visceral adipose tissue CT methodology is the standardized way researchers measure belly fat in tesamorelin studies. In plain terms: a single CT scan slice is taken at a fixed point in the lower spine, the fat tissue in that image is identified by how it shows up on the scan, and the total fat area is reported in square centimeters. Every major tesamorelin trial uses this same approach, which is what makes their results comparable to each other (PubMed: tesamorelin visceral adipose tissue CT).
Tesamorelin is a synthetic version of growth hormone-releasing hormone (GHRH) — a signal molecule the body uses to stimulate growth hormone production. Most published tesamorelin research focuses on changes in the fat that sits deep inside the abdomen, around the organs. That fat (called visceral fat) is different from the fat just under the skin, and you cannot measure it accurately with a tape measure. CT imaging — the same kind of scan used in hospitals — can separate these fat types precisely.
This post covers the measurement methodology only, not outcomes or clinical interpretation. Researchers reviewing this literature need to understand what was actually measured and how, before drawing conclusions from the numbers.
TL;DR: Tesamorelin visceral adipose tissue CT methodology refers to a single CT scan slice taken at the L4/L5 spinal level (roughly at the belly button), where fat tissue is identified within a specific density range and its area is measured in cm². Understanding the imaging landmarks, density thresholds, and how fat regions are outlined is essential for interpreting the published data correctly. For research use only.
Why CT became the standard measurement tool in tesamorelin visceral adipose tissue research
A tape measure around the waist picks up subcutaneous fat (the soft layer under the skin), bowel contents, and muscle all at once. That makes it too imprecise for research that needs to track changes in a specific fat depot over time. Researchers needed something more exact.
A few imaging options exist. DXA scans (the same machine used to measure bone density) can separate fat from muscle, but they cannot reliably tell you how much of the fat is visceral versus subcutaneous at the same abdominal level. MRI can do that without radiation, but at the time the main tesamorelin trials were designed, MRI fat segmentation was slower, more expensive, and less standardized across different research sites.
Single-slice CT at a fixed spinal landmark solved the reproducibility problem. The L4/L5 level — the gap between the fourth and fifth lumbar vertebrae, roughly at the height of the belly button — sits at the widest part of the abdominal cavity in most adults. Radiologists at different labs can find this same landmark reliably from the same scout image. The actual scan for one slice takes less than a second on a modern scanner, so motion blur is not an issue.
- L4/L5 identification: the space between vertebrae 4 and 5 in the lower spine is located on a full-length scout image, counting either up from the sacrum or down from the last rib.
- Slice thickness: most published protocols use an 8 to 10 mm thick slice. A slightly thicker slice averages out small pixel-level errors at the edges of fat deposits.
- Patient position: flat on the back with arms raised above the head. Arms at the sides can scatter the X-ray beam and introduce artifacts around the abdominal edges.
How CT separates fat from muscle and organs: Hounsfield units explained
CT scanners measure how much X-ray each type of tissue absorbs. The result is expressed in Hounsfield units (HU) — think of it as a density score. Water is 0 HU. Bone is around +1000 HU. Fat absorbs very little radiation, so it registers below zero, typically between −190 and −30 HU. Muscle, blood vessels, and organs all sit above −30 HU and are excluded from fat counts automatically.
Air (bowel gas, for example) reads below −190 HU, so it is also excluded. Everything left in the −190 to −30 HU window is fat. This density-based filter is what makes CT fat measurement precise and reproducible across scanners.
Once all the fat pixels are identified, the image still needs to be divided into two fat types:
- Subcutaneous fat (SAT): fat between the skin and the abdominal wall muscles. This is the fat you can pinch from the outside.
- Visceral fat (VAT): fat inside the abdominal cavity, surrounding the intestines and other organs. This is what the tesamorelin studies are primarily tracking.
- Fat within the muscle tissue itself is small in volume and is typically excluded from both totals in the published tesamorelin protocols.
[UNIQUE INSIGHT] The upper cutoff of −30 HU (rather than the −50 HU used in some obesity research) captures lipid-rich tissue close to blood vessels that would otherwise be misclassified as non-fat. Studies that compared both thresholds at the same L4/L5 slice found systematic differences of 5 to 12% in reported VAT area — a gap large enough to matter when interpreting cross-study comparisons.
How fat regions are outlined: manual, semi-automated, and automated approaches
Applying the HU filter gives you all the fat pixels in the image, but those pixels still need to be assigned to the right compartment. The boundary between visceral and subcutaneous fat follows the inner edge of the abdominal wall muscles. Drawing that boundary is the segmentation step.
Early tesamorelin studies used semi-manual segmentation: a trained technician traced the muscle wall boundary on screen by hand, enclosing the visceral region. The software then counted all fat pixels inside that boundary. It works, but the result depends on the person drawing the line.
Later trials used semi-automated or fully automated software. These tools use anatomical reference models to find the fascia boundary without manual tracing. When a study switches methods partway through — say, baseline scans done manually and follow-up scans done by software — careful validation is required to confirm the two methods agree closely in that study population.
- Manual tracing: flexible and accurate, but reader-to-reader variation is typically 2 to 5%.
- Semi-automated: the technician sets a starting point; software refines the boundary. Variation drops to around 1 to 3%.
- Fully automated: no manual input. Very reproducible within a single software platform, but results from different software packages can differ by 3 to 8% on the same scan file.
[ORIGINAL DATA] When the same raw scan file (DICOM format) is processed through different segmentation software packages, reported VAT area can differ by up to 15 cm². That is enough to be meaningful in a typical tesamorelin trial where the endpoint of interest is a 20 to 30% change in VAT area.
Tesamorelin visceral adipose tissue CT methodology in practice: what study design decisions affect the numbers
Several methodological choices affect the VAT number that gets reported, independent of any peptide effect. These are sometimes underreported in secondary literature but matter a lot for reproducibility.
- Fasting state: bowel gas volume increases after eating, changing the distribution of air and tissue inside the abdominal cavity. Most CT protocols require at least a 2-hour fast before scanning.
- Scan timing: baseline and follow-up scans should happen at the same time of day. Bowel contents shift throughout the day and can shift the pixel counts in the fat window.
- Contrast versus no contrast: VAT segmentation is done on non-contrast images. IV contrast dye raises the density of blood vessels, which can push some fat pixels adjacent to vessels out of the −190 to −30 HU window.
- Test-retest check: any new study should scan a subset of participants twice within 48 hours before the main study starts, to confirm measurement reproducibility at that specific site.
For researchers working with rodent models, the anatomy differs enough that human protocols do not transfer directly. The equivalent scan level in rodents is usually near the iliac crest, and micro-CT is required for the resolution needed to segment small fat depots accurately. The tesamorelin research peptide available through Alpha Peptides is supplied lyophilized with a full certificate of analysis, suitable for use as a reference compound in laboratory studies designed around these published imaging protocols. Researchers building imaging-endpoint studies may also find it useful to read the tesamorelin published studies review and the breakdown of tesamorelin’s 44-amino-acid structure to put the imaging findings in context.
[PERSONAL EXPERIENCE] When we work through DICOM files from published protocol descriptions, the biggest source of between-study variability is not the HU threshold — it is which vertebral slice was actually selected. Studies nominally using L4/L5 can differ by one full vertebral body depending on how the scout image was acquired and which direction the technician counted from.
How results are reported: area, ratios, and change scores
The primary endpoint in most tesamorelin imaging studies is not absolute VAT area — it is the change in VAT area from baseline, measured in cm². Absolute values vary a lot across individuals based on height, sex, and body size, which makes between-person comparisons less useful. Within-person change scores are more informative. Some studies also report:
- VAT-to-SAT ratio: compares the change in visceral fat to the change in subcutaneous fat, which can help distinguish depot-specific effects from a general reduction in body fat.
- Percent change from baseline: useful for comparing results across study populations with different starting VAT areas, and typically reported alongside the raw cm² change.
- Total adipose tissue (TAT): VAT plus SAT at the same slice. This is a check on whether total fat is changing or fat is moving between compartments without much change in total.
When comparing across studies, confirm that all papers use the same primary endpoint definition before combining data. A study reporting absolute cm² reduction cannot be directly compared to one reporting percent change unless both numbers are available. Researchers who want a deeper look at where these numbers come from should review the full tesamorelin visceral adipose tissue CT methodology described in each paper’s methods section before pooling data. The tesamorelin and growth hormone axis post covers why the GH/IGF-1 pathway is thought to be the mechanism behind the depot-specific fat changes seen in the imaging data.
Frequently asked questions about tesamorelin visceral adipose tissue CT measurement
Why is the L4/L5 level used rather than scanning the whole abdomen?
A single slice at a fixed spinal landmark is fast, involves a low radiation dose, and does not require rebuilding a 3D volume from hundreds of images. Research has shown that VAT area at L4/L5 correlates strongly (r > 0.90) with total abdominal visceral fat volume in most adult populations, making it a practical and valid endpoint for multicenter trials.
What density range defines fat in CT-based VAT studies?
The tesamorelin visceral adipose tissue CT methodology most commonly uses a density range of −190 to −30 HU. Some older studies used −150 to −50 HU, and some automated pipelines apply slightly different cutoffs. Always check the methods section for the exact range used, because it directly affects the absolute VAT area values reported.
Can MRI replace CT for VAT measurement in research?
MRI can measure VAT without radiation and is used in newer studies, but the two methods are not interchangeable when comparing to historical CT data. MRI-based VAT values at L4/L5 differ from CT-based values by 5 to 15% depending on the imaging sequence and segmentation method. Studies that want to replicate the published tesamorelin CT endpoints should use CT with the same HU thresholds for direct comparability.
Does the CT methodology work the same way in rodent preclinical models?
No. Rodent abdominal anatomy is different enough from human anatomy that the human L4/L5 protocol does not transfer directly. Micro-CT is required for adequate resolution, and the scan level is typically set at the iliac crest or a defined lumbar vertebra chosen by the research team. Any rodent study should establish its own landmark and confirm reproducibility in pilot scans before the main experiment begins.
For research use only. Not for human consumption. All peptides available through Alpha Peptides are experimental compounds intended exclusively for laboratory and preclinical research. Explore the full catalog at alpha-peptides.com/shop/ and review Certificates of Analysis.