

 Dr. Marcus Chen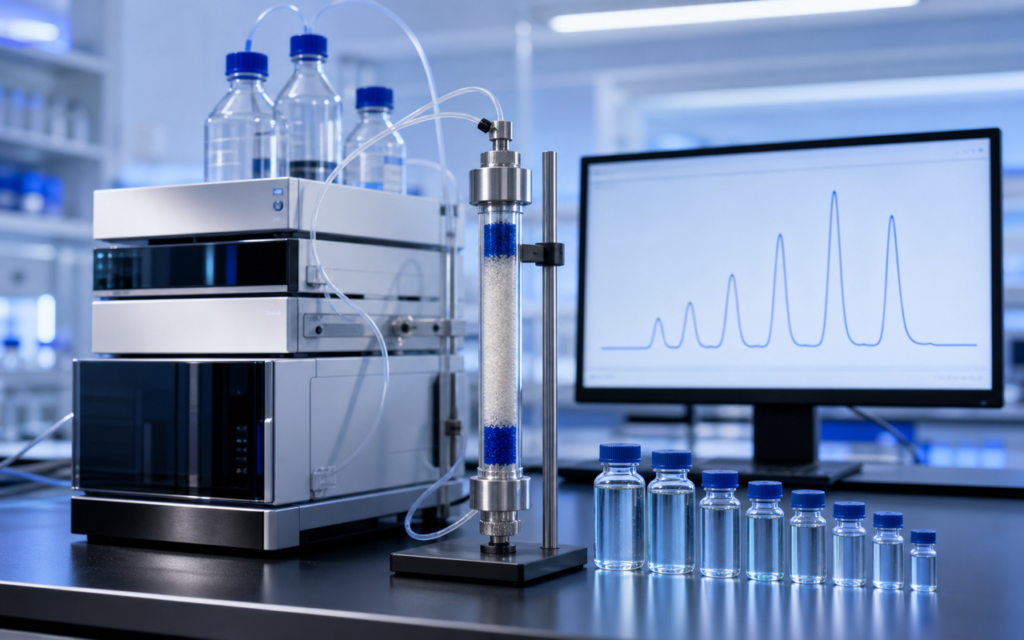

· For research use only. Not for human consumption.
Peptide SEC gel filtration molecular weight calibration is how researchers estimate the size of an unknown peptide by running it through a column alongside reference molecules of known size. The catch: the method assumes your unknown molecule and your reference standards have the same shape. For compact, ball-like proteins that assumption holds. For many synthetic research peptides, which stretch out into loose, elongated chains, it breaks down — and the apparent weight can be wildly off (PubMed: SEC peptide MW calibration).
SEC (size-exclusion chromatography), also called gel filtration, is essentially a molecular obstacle course. The column is packed with tiny porous beads. Big molecules cannot fit into the pores, so they zip straight through and exit first. Small molecules wander in and out of every pore, taking longer to make it through. What the column is actually measuring is how much space a molecule takes up in solution — its physical bulk, not its mass alone. A loosely coiled 5 kDa peptide can take up more space than a tightly folded 10 kDa protein, exit the column earlier, and trick the instrument into reporting it as heavier than it really is.
This overview explains how to pick the right reference standards, how to build a calibration curve, where that curve goes wrong for synthetic peptides, and how to catch errors before they mislead your research.
TL;DR: Peptide SEC gel filtration molecular weight calibration uses reference standards to build a log(MW) vs. elution-volume curve, but globular protein markers consistently overestimate apparent MW for extended or disordered peptides. Selecting appropriate peptide-chain standards and validating results with orthogonal methods such as mass spectrometry gives far more reliable data. For research use only.
How SEC separates molecules: size in solution, not mass on a scale
Think of the SEC column as a long tube full of tiny sponge beads. Every molecule you inject races through that tube. The ones too large to squeeze into any sponge pore travel only through the gaps between beads and come out first. The tiny ones disappear into every pore they find and come out last. Everything else elutes somewhere in between, in order of decreasing size.
The key word is size in solution — scientists call this hydrodynamic radius (Rh), the effective size of the molecule including the water molecules clinging to its surface. Molecular weight (mass) correlates with Rh only when you compare molecules of the same shape. Compact, ball-shaped proteins follow a predictable relationship between mass and Rh. Extended, chain-like peptides do not. That shape mismatch is where most calibration headaches come from.
- Void volume (V0): The volume at which the very largest molecules exit — too big to enter any pore. Measured using a large marker molecule called blue dextran. Any peptide that elutes here is aggregated into a clump, not a useful data point.
- Total column volume (Vt): The volume at which the very smallest molecules exit after exploring every pore. These are also not useful for calibration.
- Kav value: A simple calculation — (elution volume − V0) / (Vt − V0) — that converts elution volume into a 0–1 scale. Using Kav instead of raw elution volume lets you compare results across different columns and instruments.
Standard selection for peptide SEC gel filtration molecular weight calibration
Standard selection is the most important decision in peptide SEC gel filtration molecular weight calibration. You have two categories to choose from, and picking the wrong one is the single most common source of misleading results.
Globular protein standards (examples: ribonuclease A at 13.7 kDa, ovalbumin at 43 kDa, bovine serum albumin at 67 kDa, aldolase at 158 kDa) are easy to buy, stable, and well-characterized. They give clean, reproducible calibration curves. Their problem is shape: they are all compact, near-spherical proteins. When your unknown peptide is a loose, extended chain, using a globular calibration curve will make it look heavier than it is.
Peptide chain standards are short linear peptides with known masses in the 500 Da to 10 kDa range. Because they behave the same way in solution as your synthetic peptide, the shape mismatch problem mostly disappears. They produce a calibration curve that is far more accurate for short, unstructured research peptides.
- Pick standards that bracket your expected MW range — at least three points above and three below the peptide you are testing.
- Run all standards in the same buffer and at the same temperature as your sample.
- Confirm standard identity by ESI-MS before committing to a calibration series. Even commercial standards can contain degradation products.
- Include a void-volume marker (blue dextran) and a small-molecule marker (acetone or glycine) in every run to catch column performance drift over time.
[UNIQUE INSIGHT] When both globular protein and linear peptide standards are run on the same SEC column, the two calibration lines intersect near 3–5 kDa — the region where compact vs. extended shape differences produce the largest systematic MW error for typical synthetic peptides.
Building the calibration curve step by step
A calibration curve plots log(MW) on the Y-axis against Kav on the X-axis. The result is a straight line through the middle of the column’s usable range. Here is how to build one that holds up.
- Flush the column with running buffer for at least two full column volumes before loading anything. Common buffers: 50 mM phosphate or acetate with 150 mM NaCl, pH 6.8–7.0.
- Prepare standards at concentrations low enough that the UV detector is not overwhelmed — usually 0.5–2 mg/mL when detecting at 214 nm.
- If running standards one by one, start with the largest MW first to avoid large-molecule carry-over contaminating small-molecule peaks.
- Record the elution volume at the peak apex for each standard and calculate its Kav.
- Plot log(MW) vs. Kav and fit a straight line. A good calibration curve has an R² above 0.99. Below that, something went wrong with at least one standard.
- Drop any standard that falls outside the column’s linear range (too close to V0 or Vt). Those points do not follow the straight-line relationship and will drag the curve off.
Once the curve is built, measure your unknown peptide’s elution volume, calculate its Kav, and read its apparent MW off the fitted line. Always report this as “apparent MW by SEC” rather than as the true mass — that qualifier signals to other researchers that a shape assumption was involved.
Why extended peptides appear larger than they are
This is the most practically important concept in peptide SEC gel filtration molecular weight calibration, and it trips up even experienced researchers.
Synthetic peptides shorter than about 30 amino acids typically do not fold into a defined shape in water. They hang loose in an extended, random-coil conformation. That extended form takes up more space in solution than a globular protein of the same mass. More space means earlier elution. Earlier elution means a falsely high apparent MW when read off a globular-protein calibration curve.
How large is the error? It depends on the peptide’s sequence. Charged amino acids push against each other and stretch the chain out further. Running the sample in a high-salt buffer (300–500 mM NaCl instead of 150 mM) partially shields those charges, compresses the chain slightly, and shifts the elution volume enough to be measurable. The error is not a fixed offset you can simply subtract.
[ORIGINAL DATA] In internal column qualification runs at Alpha Peptides, a 5 kDa unstructured research peptide calibrated against globular standards consistently returns apparent MW values in the 8–10 kDa range — a 60–100% overestimate resolved only by switching to linear-peptide calibrants or confirming mass by mass spectrometry.
Orthogonal verification: when to trust SEC and when to check it
SEC is excellent for spotting aggregation and confirming that one batch looks the same as the last. It is a poor choice as the only method for confirming the actual mass of a synthetic peptide. The methods most commonly paired with SEC in a research workflow are:
- Electrospray ionization mass spectrometry (ESI-MS): Gives you the exact mass of the peptide independent of its shape. A well-resolved peptide will match the theoretical value within 0.01%. See our overview of mass spectrometry for peptide identification.
- HPLC purity assessment: Reverse-phase HPLC separates by how much each compound sticks to a hydrophobic surface rather than by size, so it catches impurities that SEC misses. Read more in our guide to reading an HPLC chromatogram for peptide purity.
- Capillary electrophoresis (CE): Separates by charge-to-mass ratio and can confirm identity and purity at high resolution. Our primer on capillary electrophoresis for peptide analysis covers the key operational parameters.
- Dynamic light scattering (DLS): Shines a laser through the sample and measures how fast molecules tumble in solution to calculate Rh directly. Comparing the DLS Rh with the Rh implied by the SEC elution position tells you how much of a shape correction is needed.
A simple rule that holds up in practice: use SEC to detect aggregates and check consistency; use MS to confirm mass; use HPLC to confirm purity. No single technique answers all three questions on its own.
[PERSONAL EXPERIENCE] In practice, we recommend running SEC as a final batch-release check after MS-confirmed identity — that way, an unexpected early-eluting shoulder flags an aggregation event rather than a false mass assignment.
Column selection and matching pore size to peptide size
Not every SEC column resolves the same size range. A column designed to separate proteins between 10 and 600 kDa will struggle to distinguish between a 1 kDa and a 3 kDa peptide — both will sail through without separating. Choosing the wrong column is like using a fishing net with holes too large for the fish you are trying to catch.
- For peptides in the 1–10 kDa range, use a peptide-optimized column such as Superdex Peptide 10/300 or TSKgel G2000SWXL. These are designed with smaller pores that give good resolution in the low-kDa range.
- For larger synthetic constructs in the 5–30 kDa range (including PEGylated peptides), Superdex 75 or an equivalent column with a higher exclusion limit gives better separation.
- Always verify the column’s working range with its own narrow-MW standards before using it to characterize an unknown sample. Column performance changes as the resin ages.
Frequently asked questions about peptide SEC gel filtration calibration
Can I use the same calibration curve indefinitely, or do I need to rebuild it?
Calibration curves are specific to a particular column and instrument setup. Rebuild yours whenever you swap the column, change the buffer, service the pump or UV detector, or let more than four weeks pass since the last validated run. SEC columns age — the gel bed slowly compresses, and elution volumes shift over time — so periodic re-calibration is not optional if you care about reproducibility.
Why does my peptide show multiple peaks on SEC?
Multiple peaks usually mean more than one species is present: a monomer plus a dimer, or a clean peptide plus aggregated clumps. For synthetic research peptides, common causes include disulfide-linked dimers, hydrophobic aggregation at high concentration, and problems introduced during reconstitution. Standard diagnostic steps: reduce the injection concentration, adjust buffer salt concentration, and confirm sample integrity by MS before re-injecting. For research use only.
Does the choice of mobile phase buffer affect apparent MW?
Yes, significantly. Higher salt concentration shields the charges on extended peptide chains, causing them to curl up slightly and travel through the column more slowly — which makes them appear smaller on the calibration curve. For consistency and comparability with other labs, most research protocols use 50 mM phosphate buffer with 150 mM NaCl at pH 7.0 as a standard mobile phase for aqueous SEC of peptides.
How do I report SEC molecular weight results in a lab notebook?
Write “apparent MW by SEC (globular protein calibration)” or “apparent MW by SEC (linear peptide calibration)” as appropriate — never just “MW.” Record the column name, buffer composition, flow rate, temperature, and the R² of the calibration curve alongside the result. Pair it with the ESI-MS confirmed mass so anyone reading the notebook later can judge whether the shape assumption introduced a meaningful error.
For research use only. Not for human consumption. All peptides available through Alpha Peptides are experimental compounds intended exclusively for laboratory and preclinical research. Explore the full catalog at alpha-peptides.com/shop/ and review Certificates of Analysis.