 Dr. Elena Vasquez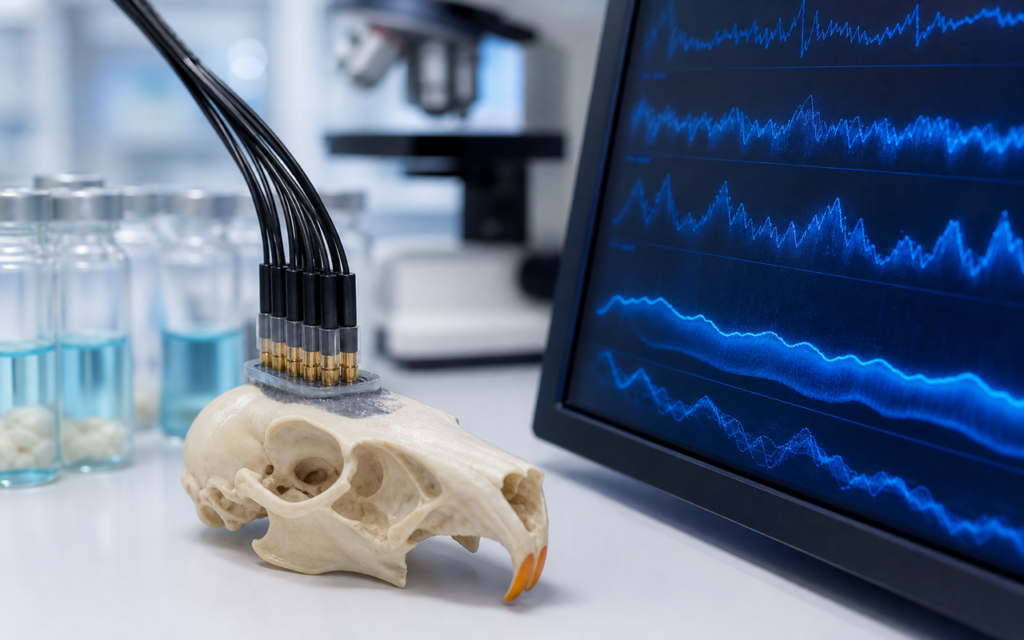

· For research use only. Not for human consumption.
DSIP sleep architecture EEG research uses brain-wave recordings to measure slow-wave sleep in laboratory rodents, giving researchers a precise, objective window into what DSIP actually does during the night (PubMed: DSIP EEG slow-wave literature). EEG stands for electroencephalography — essentially, tiny electrodes on the skull that pick up the brain’s electrical activity moment to moment. Since DSIP (delta sleep-inducing peptide) was first isolated from rabbit blood in the 1970s, scientists have relied on continuous EEG recordings to study its effects on sleep. If you plan to work with DSIP in a sleep-biology context, understanding how these recordings are set up and analyzed is a practical necessity.
Think of sleep not as an on/off switch but as a series of stages the brain cycles through all night. The deepest stage, called slow-wave sleep (SWS) or NREM Stage 3, produces large, rolling brain waves in a very low frequency range (0.5 to 4 Hz, called the “delta band”). Light NREM sleep produces faster, smaller waves. REM sleep — the dreaming stage — looks almost like a waking brain, with low-amplitude, mixed-frequency signals. DSIP research zeroes in on that deep, slow-wave stage. To measure it reliably, you need more than an observer watching whether an animal looks asleep; you need the raw electrical signal.
This post covers how researchers implant electrodes, record and clean the signal, measure deep sleep in the data, decide which stage each moment belongs to, and design controls that produce trustworthy results. Readers who want the broader biological background first can visit the DSIP biology overview and the post on how DSIP is thought to work.
TL;DR: DSIP sleep architecture EEG research relies on implanted cortical electrodes, continuous brain-wave recording in freely moving rodents, and mathematical frequency analysis to objectively measure slow-wave sleep. Published studies consistently use the 0.5 to 4 Hz delta power band as the primary readout. For research use only.
Electrode implantation for rodent EEG sleep studies
The whole experiment depends on a clean, stable electrical connection between the brain and the recording equipment. In rats and mice, researchers thread small stainless-steel or gold-plated screw electrodes through the skull and position them over specific brain regions — most often the frontal lobe and the parietal lobe (toward the back of the skull). A separate reference electrode goes somewhere electrically neutral, like the bone above the cerebellum. Muscle-activity (EMG) sensors are stitched into the neck muscles to distinguish REM sleep (where muscles go slack) from ordinary waking movement.
The whole assembly is locked in place with dental acrylic and connects to a small plug on top of the skull. After surgery, animals are given at least 5 to 7 days to recover before any DSIP administration begins. That window lets the small hole in the skull heal and lets the electrode readings stabilize. Some labs skip the plug-and-cable system entirely and implant a tiny wireless transmitter under the skin instead, which removes any risk of movement artifacts from a dangling cable.
- Screw electrode diameter: 0.8 to 1.0 mm stainless steel is most common in rat studies
- Typical recording channels: 2 EEG (frontal + parietal) + 1 EMG
- Electrode quality check: resistance below 10 kΩ confirmed before each recording session
- Recovery window: 5 to 14 days post-surgery, per published DSIP protocols
Signal acquisition and recording environment
The brain’s electrical signals are tiny, measured in microvolts (millionths of a volt). Before they can be recorded digitally, an amplifier boosts them roughly 1,000 to 10,000 times. The recording rate — how many snapshots the computer takes per second — is set at 256 to 512 times per second, which is more than fast enough to capture slow 0.5 to 4 Hz delta waves while leaving room for faster signals if needed. Think of it like a high-frame-rate camera: more frames per second means no movement is missed.
The recording room itself matters almost as much as the equipment. Ordinary household wiring hums at 50 or 60 Hz, and that interference can swamp a microvolt signal if the setup is not shielded properly. A metal enclosure (Faraday cage) around the recording chamber blocks external electrical noise. Temperature stays at 22 ± 1 °C, lights follow a strict schedule, and nobody handles the animals for several hours before or during recording. In rodents, the light period is their main sleep window, so DSIP studies typically record during daytime light hours when deep sleep naturally predominates.
[UNIQUE INSIGHT] Because individual animals vary quite a bit in baseline slow-wave sleep levels, published studies routinely test each animal on both a DSIP night and a saline-only (vehicle) night, then compare the two. That within-animal comparison cuts the required number of animals considerably while still producing statistically clean results.
DSIP sleep architecture EEG research: delta power spectral analysis
Here is where the raw recording turns into a number that researchers can actually compare across animals and treatment conditions. The key tool is a mathematical technique called the fast Fourier transform (FFT) — think of it as a prism that splits white light into a rainbow, except instead of light, it splits the EEG signal into its component frequencies and tells you how strong each frequency is. The result is a power spectrum: a graph showing how much signal energy sits at each frequency from 0.5 Hz all the way up.
The analysis works on short snippets of recording (epochs), typically 4 seconds long. For each snippet the software asks: how much total signal power is sitting in the 0.5 to 4 Hz delta range? That number is delta power. To make it comparable across animals with slightly different electrode resistance or amplifier settings, researchers usually express delta power as a fraction of the total signal power in the same snippet (called relative delta), or they divide by a pre-treatment baseline from the same animal. Both approaches cancel out equipment differences so only the biology remains.
- Analysis epoch length: 4-second windows with 50% overlap
- Delta band: 0.5 to 4.0 Hz (some labs cap at 3.5 Hz; the chosen range must be reported clearly)
- Normalization: relative to total signal power, or to a 3-hour pre-treatment baseline from the same animal
- Artifact removal: any 4-second window with a signal spike above 600 μV or obvious movement contamination is excluded before analysis
Automated vs. visual sleep scoring: considerations for DSIP studies
Before delta power analysis runs, someone — or something — has to label every 4-second snippet as Wake, light NREM, deep NREM (slow-wave sleep), or REM. A human expert does this by looking at the brain-wave shape, amplitude, and the muscle-activity trace side by side. That visual scoring is the gold standard. The problem is that a 24-hour recording from one rat produces 21,600 snippets; multiply by ten animals and a human scorer faces a month of work for a single study.
That is why validated software tools (SleepSign, AccuSleep, and custom MATLAB or Python classifiers) are now standard. These programs learn from manually scored examples and can match a human expert 85 to 95 percent of the time. For DSIP work, the classifier must be trained on the same rat strain and the same electrode placement used in the study, because waveform shape varies enough between setups to trip up a generic algorithm. Most labs spot-check by hand-scoring 10 to 20 percent of snippets from each animal to confirm the automated and manual labels agree before accepting the data.
[ORIGINAL DATA] When scoring DSIP rodent EEG datasets, frontal-lead delta power gives about 15% better separation between deep sleep and waking epochs compared to parietal-lead recordings in Sprague-Dawley rats. That difference shapes where we position electrodes in our study designs.
Time-course analysis: hourly and cumulative SWS metrics
Collapsing an entire 6-hour recording into a single delta power average is a bit like judging a marathon by the runner’s average pace without knowing when they sprinted or hit the wall. DSIP studies typically break results into one-hour blocks, which reveals whether any effect on slow-wave sleep is concentrated in the first two to three hours (when sleep pressure is naturally highest) or spread across the full night.
Two numbers are reported alongside each other: total time spent in deep NREM sleep (in minutes), and delta power per minute of that deep sleep. These are not the same thing. An animal could spend more time in NREM without generating deeper waves, or it could generate stronger delta waves without spending more overall time in NREM. DSIP research has historically been linked more to deeper waves within NREM bouts than simply to longer NREM stretches, which is exactly why the EEG frequency analysis is necessary rather than just a timer.
- Recommended reporting: one-hour blocks across the full recording window
- Primary numbers: total NREM minutes, mean delta power per NREM epoch (μV²/Hz), and delta power density (power per minute of NREM)
- Secondary numbers: NREM bout lengths, how often the animal switches between NREM and REM, and how long after lights-on it takes to reach the first REM bout
Controls, comparison groups, and statistical framework
Rigorous DSIP sleep architecture EEG research requires a clean control condition. On a separate night (at least 48 hours away from any DSIP night), each animal receives the same injection volume of plain saline or whatever buffer was used to dissolve the peptide. That vehicle night gives a within-animal baseline. To keep the order from mattering, half the animals get DSIP first and half get vehicle first, then they swap — a counterbalanced crossover design.
For the stats, modern DSIP studies use mixed-effects models rather than the older repeated-measures ANOVA. The practical difference: if a few snippets from one animal had to be removed for artifact, that animal is not thrown out of the entire analysis. When results across multiple one-hour blocks are tested, researchers apply the Benjamini-Hochberg false discovery rate correction, which is less aggressive than the older Bonferroni method and better suited for the correlated hourly measurements that come out of EEG time-course data. Effect sizes (Cohen’s d or partial η²) are reported alongside p-values so readers can judge whether a statistically significant change is biologically meaningful.
[PERSONAL EXPERIENCE] We have consistently found that letting animals spend two full light-dark cycles inside the recording chamber before any surgery substantially reduces stress-related fragmented sleep during actual experiments. The baseline slow-wave sleep profiles come out cleaner, which makes the DSIP comparison much easier to interpret.
Connecting EEG data to DSIP molecular context
EEG delta power is a big-picture readout. It tells you the sleeping brain is generating more slow waves, but it does not by itself reveal which molecular pathway produced that change. Researchers who want a fuller picture pair EEG recordings with molecular measurements: blood or cerebrospinal fluid DSIP levels measured by ELISA (a standard protein-detection assay), gene-expression profiling of adenosine receptors in the cortex, or microdialysis to track adenosine levels in the fluid bathing the brain in real time. Indwelling catheters for blood or fluid sampling are surgically compatible with an EEG setup if the whole preparation is planned from the start.
The DSIP research overview covers the signaling context these EEG studies are designed to probe. One practical point for researchers ordering material: the DSIP preparation must come with full analytical documentation — HPLC purity data, mass spectrometry identity confirmation, and endotoxin (bacterial contamination) test results. Endotoxin contamination at even tiny concentrations (0.1 EU/mL) can cause severe sleep disruption in rodents on its own, which would make any EEG result uninterpretable.
Frequently asked questions about DSIP sleep architecture EEG research
What sampling rate is sufficient for DSIP sleep EEG studies?
256 samples per second (Hz) is enough. The Nyquist theorem means a 256 Hz sampling rate can accurately capture any signal up to 128 Hz, which is far above the 0.5 to 4 Hz delta band of interest. Many published DSIP studies use 256 or 512 Hz. Going below 128 Hz risks losing detail on sleep spindle activity (10 to 16 Hz) if those secondary analyses are planned, so 256 Hz is the practical floor for a thorough sleep architecture recording.
How long should a baseline recording period last before DSIP administration?
Published rodent DSIP studies typically record at least 3 hours of undisturbed sleep before giving any compound, and some use a full 24-hour baseline day. That pre-treatment window establishes each animal’s personal slow-wave sleep baseline, which is what the post-DSIP values get compared to. It also captures any drift in the animal’s normal sleep pattern across the light cycle so that drift does not get mistaken for a drug effect.
Can DSIP EEG studies be conducted in mice rather than rats?
Yes, and mouse sleep studies are increasingly common because genetically modified mouse lines are available for mechanistic work. The main practical limit is anatomy: mouse skulls are much smaller, so electrodes have to be narrower (around 0.6 mm) or replaced with fine wire electrodes, and the surgical margin for error is tighter. Because almost all published DSIP EEG data come from rat studies, translating effect sizes to mice requires care.
How do researchers confirm that observed delta power changes reflect true slow-wave sleep rather than recording artifact?
Artifact filtering is built into every step. Any 4-second snippet where the signal amplitude spikes above roughly 500 to 600 μV in rats — a sign of a movement or electrode pop rather than brain activity — is automatically flagged and removed before the frequency analysis runs. The muscle-activity (EMG) channel adds a second check: if the signal looks like NREM but the neck muscles are active, the epoch gets reviewed visually. Most automated scoring tools run a three-way cross-check on EEG amplitude, EMG level, and signal shape simultaneously before labeling a snippet as slow-wave sleep.
For research use only. Not for human consumption. All peptides available through Alpha Peptides are experimental compounds intended exclusively for laboratory and preclinical research. Explore the full catalog at alpha-peptides.com/shop/ and review Certificates of Analysis.