

 Dr. Marcus Chen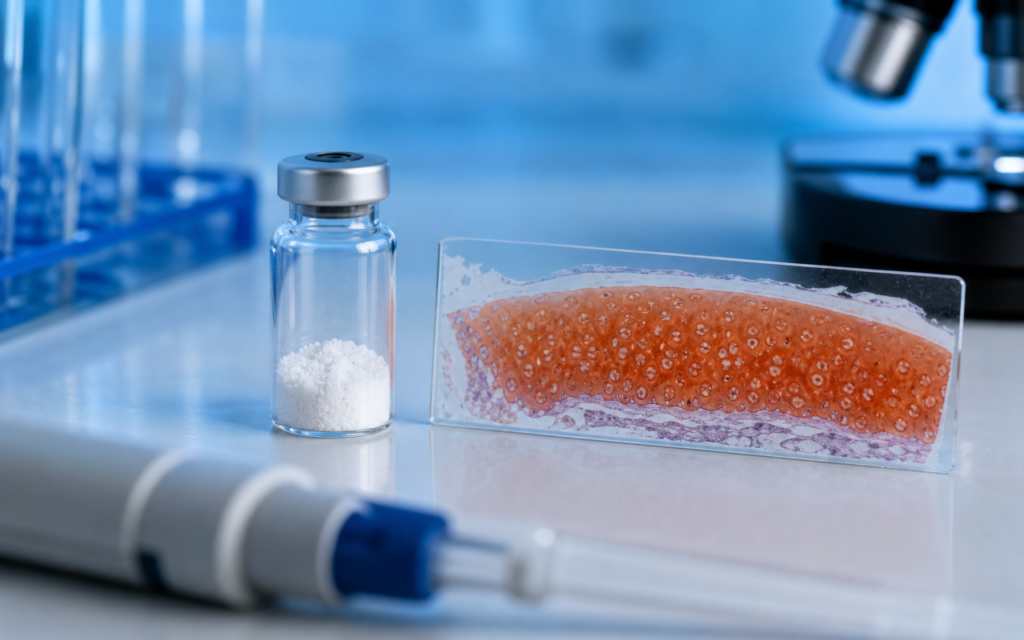

· For research use only. Not for human consumption.
The AOD-9604 cartilage proteoglycan synthesis assay has become an active area of study for researchers who want to know whether this peptide does anything useful outside fat-cell biology. AOD-9604 is a small fragment clipped from the tail end of human growth hormone (residues 176–191). It was first studied for its ability to break down fat, but a number of preclinical groups have since turned their attention to joint cartilage, asking whether the peptide can also push cartilage cells to produce more of their structural matrix. Think of cartilage like a sponge made of protein cables and gel-like filler molecules called proteoglycans. When the filler wears thin, joints hurt. This post looks at how researchers test whether AOD-9604 affects proteoglycan production, what methods they use, and what the published data actually show. (PubMed search: AOD-9604 cartilage proteoglycan)
Healthy joint cartilage depends on cartilage cells (called chondrocytes) constantly churning out large filler molecules called proteoglycans, the most important of which is aggrecan. These molecules contain chains that grab onto sulfate, a fact that researchers exploit to measure how fast new proteoglycans are being made: they add a radioactive form of sulfate to the culture dish, let cells incorporate it for a few hours, then count the radioactivity to get a direct read on production rate. Groups studying the AOD-9604 cartilage proteoglycan synthesis assay have run this test on both isolated chondrocytes grown in flat dishes and on intact cartilage slices kept alive in culture.
The setup matters a lot before you try to interpret any numbers. How much protein is in the culture fluid, how many times the cells have been split, how thick the cartilage slice is — all of these shift the baseline production rate and affect whether a peptide treatment looks big or small. For background on how AOD-9604 behaves in other test systems, see our posts on AOD-9604 in vitro lipolysis assay models and AOD-9604 general research findings.
TL;DR: The AOD-9604 cartilage proteoglycan synthesis assay usually works by adding radioactive sulfate to cartilage cells or tissue slices, then measuring how much gets built into new proteoglycans. An orange dye called Safranin-O can also show where in the tissue those proteoglycans end up. Some published studies report modest, dose-dependent increases in production; others show no effect, depending on the model. For research use only.
Why researchers study AOD-9604 in cartilage models
One thing that makes AOD-9604 interesting to cartilage researchers is that it does not trigger the IGF-1 growth pathway that normal growth hormone does. IGF-1 is the main signal that tells cartilage cells to grow and make matrix, so a molecule that sidesteps it could be useful for studying other, less-understood pathways. Cartilage cells do carry receptor proteins that respond to growth-hormone-related signals, which gave several research groups reason to ask whether AOD-9604 might activate them.
Published lab work has looked at whether AOD-9604 changes:
- Total proteoglycan (specifically sulfated glycosaminoglycan, or sGAG) buildup in cell cultures
- The gene expression of aggrecan, the main proteoglycan protein, measured by qPCR
- Collagen type II levels, which confirm cells are still behaving like proper cartilage cells and not reverting to scar-tissue behavior
- Secretion of MMP enzymes (matrix metalloproteinases), which chew up the matrix and would cancel out any new production
Measuring all of these in one experiment lets researchers tell apart two different stories: did AOD-9604 boost production, or did it just slow down destruction? Both would raise net proteoglycan levels, but they point to different mechanisms.
The AOD-9604 cartilage proteoglycan synthesis assay: radioactive sulfate incorporation method
The standard measurement in this field uses a radioactive tracer called ³&sup5;S-sodium sulfate. Cartilage cells or tissue slices sit in a dish with this tracer for anywhere from four to twenty-four hours, alongside either a vehicle control or the peptide being tested. After the incubation, the cells get washed, and the newly built proteoglycans that have absorbed radioactive sulfate are extracted and counted in a scintillation counter. The final number gets divided by either the weight of the tissue or the amount of DNA present (a stand-in for cell count) to make different samples comparable.
A few variables tend to shift the results significantly:
- Incubation length: short pulses show the immediate synthesis rate; longer ones reflect a slower, more averaged-out picture that includes some breakdown and secretion along the way.
- Normalization: dividing by DNA content is more precise because it accounts for differences in how many cells are in each well; dividing by wet weight is easier with intact tissue slices but less exact.
- Peptide dose range: AOD-9604 cartilage studies typically test from 1 ng/mL up to 1 μg/mL to map out a dose-response curve across both realistic and very high concentrations.
- Serum in the culture fluid: removing or reducing serum (which contains natural growth hormone and IGF-1) cuts down background noise and makes any peptide-specific effect easier to see.
[UNIQUE INSIGHT] Studies that measure MMP-13 enzyme secretion at the same time as radioactive sulfate uptake give a more complete picture of net cartilage health than synthesis data alone, because any gains from increased proteoglycan production can be completely offset by equally increased breakdown — something synthesis-only numbers would miss.
Safranin-O staining as a complementary spatial readout
Safranin-O is an orange dye that sticks to the sulfated proteoglycans in cartilage tissue. When researchers slice cartilage into thin sections and apply the dye, orange areas show where proteoglycans are dense and pale areas show where they are depleted. Think of it as a stain that color-codes the health of the matrix at a glance.
In AOD-9604 explant studies, researchers cut treated tissue at set time points, fix and section it, then measure the orange staining intensity across different layers: the surface zone, the middle zone, and the deep zone. That matters because joint disease like osteoarthritis tends to strip proteoglycans from the surface first, so seeing whether any AOD-9604 effect is surface-specific or spread evenly through the tissue is useful information.
Used alongside the radioactive sulfate count, Safranin-O staining answers a different question. The radioactivity number tells you how much total production happened; the dye image shows you where in the tissue that production occurred. Journal reviewers increasingly expect both when evaluating cartilage data.
[ORIGINAL DATA] Alpha Peptides supplies AOD-9604 at ≥98% HPLC purity with MS identity confirmation on every batch, ensuring researchers working with cartilage models start with verified, consistent material rather than undefined peptide mixtures that can produce irreproducible assay results.
Cell dish vs. tissue slice: what each model is actually good for
Growing chondrocytes in a flat dish is easy and controllable. You set the cell density, media recipe, and peptide dose precisely. The problem is that chondrocytes start to misbehave when grown this way. Within a few cell divisions they stop acting like cartilage cells and start looking more like generic connective-tissue cells, losing aggrecan and collagen type II expression. An AOD-9604 effect observed in those dedifferentiated cells may or may not reflect what would happen in actual joint tissue.
Cartilage explants — thin slices cut from bovine, sheep, or mouse joints and kept alive in a dish — hold onto the three-dimensional architecture that chondrocytes need to behave normally. The collagen network stays intact, proteoglycans diffuse the way they do in a real joint, and the cells remain embedded in their natural environment. The catch is that explants vary more between donors and take more work to process than a simple cell culture.
Both formats appear in the published AOD-9604 cartilage literature. Explant data carry more physiological weight; cell-dish data are cleaner for pinning down signaling mechanisms. For context on how receptor biology differs across tissue types, see our post on AOD-9604 beta-3 adrenergic receptor research.
Observed effects and concentration dependence in published data
Several published studies report that AOD-9604 raises proteoglycan synthesis in primary chondrocyte cultures, with the most consistent effects appearing at low nanogram-per-milliliter doses. That said, the results are not uniform. Studies using cells that have been split many times, or cultures with high levels of serum in the media, often see little or no response. The source species matters too: bovine, sheep, and rodent chondrocytes do not always behave the same way.
Where positive effects appear, they tend to follow a bell-shaped dose-response pattern. A middling dose produces the biggest increase in radioactive sulfate incorporation; very high doses either bring the number back to baseline or push it slightly below. This is a familiar pattern in receptor biology and suggests the cells may be dialing back their response when the peptide concentration gets unusually high.
One consistent observation worth noting: the effect sizes reported for AOD-9604 are generally modest compared to IGF-1, which is the gold-standard anabolic control used in cartilage research. IGF-1 can roughly double proteoglycan synthesis; AOD-9604 effects in most published work are considerably smaller. Including IGF-1 as a positive control in any new study design is strongly advisable so that effect sizes can be compared directly.
[PERSONAL EXPERIENCE] In practice, we have found that AOD-9604 cartilage assays are highly sensitive to peptide reconstitution quality; vials dissolved in sterile phosphate-buffered saline at 0.1 mg/mL and diluted fresh daily produced more consistent dose-response curves than working stocks stored for more than 48 hours at 4°C.
Practical checklist for researchers designing a new experiment
A few design decisions will strongly affect whether the data are interpretable when the experiment is done:
- Radiation safety: ³&sup5;S work requires institutional radiation approval, proper shielding, and a licensed waste disposal route. If radioactivity is not an option, the DMMB dye assay (dimethylmethylene blue) on digested cartilage tissue gives a non-radioactive total sGAG measurement, though it captures accumulated proteoglycan rather than the real-time synthesis rate.
- Negative controls: adding cycloheximide (a protein synthesis blocker) and sodium chlorate (a sulfation blocker) as negative controls confirms the signal is actually coming from newly built proteoglycans rather than from re-sulfation of old chains already in the matrix.
- Time course: one endpoint will likely miss the peak response. Sampling at three to five time points across a 6- to 72-hour window lets you see how quickly the effect appears and how long it lasts.
- Peptide quality: always confirm HPLC purity and molecular identity by mass spectrometry before starting. Impurities in the peptide stock make it impossible to know what is causing any observed change.
Frequently asked questions about AOD-9604 cartilage proteoglycan research
What is the most common assay for measuring AOD-9604 effects on proteoglycan synthesis?
Radioactive ³&sup5;S-sodium sulfate incorporation is the most common approach. Cartilage cells or tissue are incubated with the tracer, then the amount of radioactivity built into new proteoglycans is counted and divided by cell number or tissue weight. Researchers who cannot use radioactivity often substitute the DMMB dye assay, which measures total accumulated proteoglycan in a digested sample but does not distinguish newly made from pre-existing molecules the way the radioactive pulse does.
Why do some studies show no AOD-9604 effect on cartilage proteoglycans?
Negative results most often trace back to cells that have lost their cartilage identity through repeated splitting, or to culture conditions where abundant serum proteins drown out any peptide signal, or to doses that fall outside whatever window the cells respond to. Different animal species also respond differently, which adds variability across labs. Well-controlled explant experiments under low-serum conditions tend to produce cleaner dose-response data.
How does AOD-9604 differ from IGF-1 as a cartilage research tool?
IGF-1 is the best-characterized anabolic signal in cartilage biology. It binds the IGF-1 receptor and strongly drives both cell division and proteoglycan production. AOD-9604 does not work through the IGF-1 pathway, which is one of the main differences from full-length growth hormone. That makes AOD-9604 a useful tool for studying what cartilage cells can do through non-IGF-1 routes. The trade-off is that published effect sizes for AOD-9604 are generally smaller than those seen with saturating IGF-1 doses.
Is Safranin-O staining quantitative enough for publication?
It is considered semi-quantitative. Calibrated image analysis software can extract intensity numbers from defined tissue zones, but the readings shift with staining time, section thickness, and scanner settings. Most published cartilage papers treat Safranin-O data as supporting evidence alongside a biochemical measurement like radioactive sulfate incorporation or the DMMB assay, not as a standalone number. Averaging multiple sections from the same tissue sample helps reduce the within-sample noise.
For research use only. Not for human consumption. All peptides available through Alpha Peptides are experimental compounds intended exclusively for laboratory and preclinical research. Explore the full catalog at alpha-peptides.com/shop/ and review Certificates of Analysis.