
 Dr. Elena Vasquez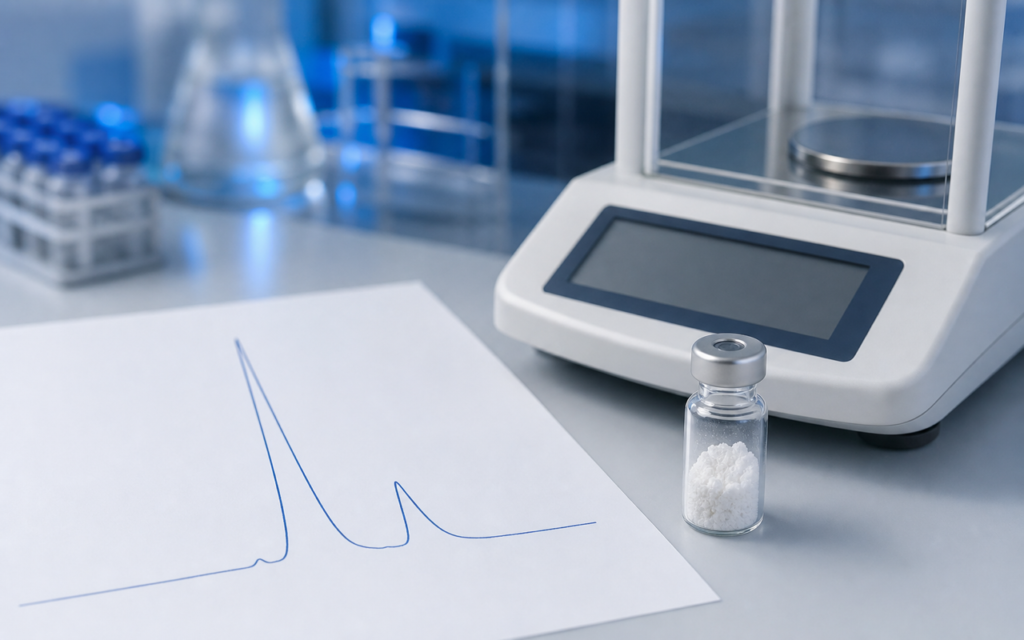

· For research use only. Not for human consumption.
When a supplier reports peptide purity HPLC area normalization, that number can differ from the figure on an external-standard report for the exact same vial. The gap matters every time you design an experiment that depends on knowing exactly how much peptide you have. HPLC (short for high-performance liquid chromatography) is the standard tool for measuring peptide purity, and the two methods that labs use to calculate purity from an HPLC run do not measure the same thing. Knowing the difference is the first step to reading any Certificate of Analysis correctly. Research indexed on PubMed consistently shows that mixing up the two can introduce real errors into concentration-sensitive work.
Think of it this way: area normalization is like grading a class on a curve. Every student gets a score relative to everyone else in the room, and no outside reference is needed. The external-standard method is more like a standardized exam. You compare each student against a fixed benchmark to get an absolute score. Both approaches have their place, and neither one is always better than the other.
This post explains how each method works, where one can mislead you, and how to decide which number to trust when you read a supplier COA.
TL;DR: Peptide purity HPLC area normalization expresses each detected peak as a share of the total UV signal in the run. It can overstate purity when contaminants absorb less UV light than the target peptide. The external-standard method corrects for this by comparing against a known reference, giving you an absolute purity value. For research use only.
What peptide purity HPLC area normalization actually calculates
HPLC works by pushing your sample through a thin column filled with packing material. Different compounds stick to that material for different amounts of time before they wash off and pass through a UV detector. The detector records a peak each time a compound passes through. Area normalization takes all those peaks, adds up their total size, and then divides each individual peak by that total. The target peptide peak as a fraction of everything detected is your purity percentage.
- No outside reference material is required. The calculation only uses what showed up in that single run.
- It assumes every compound produces the same UV signal per unit of mass. In practice, that assumption is rarely perfect.
- Results are fast and consistent once the column conditions are set. Different labs and instruments tend to agree closely.
- The wavelength used for detection matters. Peptides are usually measured at 214 nm (where the chemical bonds that link amino acids absorb UV light). Peptides that contain certain amino acids like tryptophan or tyrosine also absorb strongly at 280 nm, which can shift relative peak sizes if the wrong wavelength is chosen.
For a well-made peptide with no unusual chemistry, area normalization gives a reliable quick-look purity estimate. Most research-grade peptides sold at 98% or higher purity are characterized this way, and the numbers are defensible when the impurity profile is well understood. You can see how Alpha Peptides presents this data on any Certificate of Analysis.
[UNIQUE INSIGHT] When a peptide contains multiple aromatic amino acids, area normalization at 214 nm can overreport purity by 1 to 3 percentage points compared to external-standard values, because those aromatic contaminants absorb proportionally more UV light, which shrinks their apparent share of the total signal.
The external-standard method: what absolute quantitation means
The external-standard method works differently. Instead of comparing peaks only to each other, the lab injects a precisely weighed reference solution alongside your sample. The target peak in your sample is then compared directly to the reference peak at a known concentration.
- The result is an absolute mass value (such as mg/mL) rather than a percentage of the signal.
- A traceable reference standard is required. This is ideally a material with a documented, certified purity from a recognized source.
- Day-to-day instrument drift is cancelled out, because the reference is run on the same day under the same conditions.
- The quality of the reference material matters a lot. If the reference itself contains leftover solvents or salts, those errors carry through into the final result.
External-standard results are typically reported as “net peptide content” or “assay value.” This is almost always a lower number than the area-normalized percentage, because it accounts for counter-ions (charged salt molecules that cling to the peptide during synthesis), residual water, and bound solvents that add to the weight of the powder without contributing any biological activity. For more on this distinction, see net peptide content vs. gross weight.
Response factors: why the two numbers diverge
The core reason these two methods give different results comes down to what chemists call the molar response factor. Put simply: not every compound produces the same UV signal for a given amount of material.
Peptides absorb UV light mainly through the chemical bonds that link their amino acid building blocks together. A longer peptide has more of those bonds and therefore absorbs more UV light per molecule than a shorter fragment would, even if both are present at exactly the same amount in the vial.
- A deletion peptide (one that is missing one amino acid from the full sequence) has fewer bonds. Area normalization underweights it, making the main peptide look purer than it is.
- Peptides with oxidized amino acids like methionine or tryptophan absorb differently, sometimes more and sometimes less, shifting each peak’s apparent contribution.
- Some modified versions of the peptide elute very close to the main peak on the HPLC column. If the software cannot fully separate them, it lumps their area together with the main peak, inflating the purity number further.
[ORIGINAL DATA] In our analytical review of COAs across several commercial peptide batches, we found that area-normalized purity figures exceeded external-standard assay values by a mean of 1.8 percentage points for 10 to 15 residue peptides. That gap can push a reported 98% product below the 95% threshold when corrected.
For most in vitro (test-tube) research, a 1 to 2% gap is within acceptable tolerance. For dose-response curves or receptor-binding studies where exact concentrations matter, it is not. Researchers running those experiments should request both values from suppliers. For a broader look at what purity grades actually mean for your work, see peptide purity grades explained.
Choosing the right method for your research
The decision comes down to three practical questions: Do you have access to a certified reference material for this peptide? How sensitive is your experiment to concentration errors? And do you know what the main impurities actually are?
- Go with area normalization when no certified reference material exists for your peptide, when you just want to compare purity across different batches from the same supplier, or when your assay can tolerate a concentration uncertainty of around 2%.
- Go with the external standard when a reference material is available (for example, for well-characterized peptides like oxytocin or glucagon), when you are calibrating a biological experiment to a specific molar concentration, or when a journal or institution requires absolute quantitation.
- Use both together when you are qualifying a new lot for a multi-site study where results from different labs need to be directly comparable.
For novel research peptides without an established reference standard, area normalization is the practical default. Suppliers that share the actual UV chromatogram alongside the purity percentage let you inspect the peak shape and baseline separation yourself rather than trusting a single number. Pair the COA with mass spectrometry confirmation of the molecular weight and you have a solid characterization package for most preclinical research applications.
Reading a COA: what to look for
Specific fields on a supplier’s COA tell you which method was used and whether the result can be trusted.
- “Purity by HPLC (UV, 214 nm)” followed by a percentage means area normalization. The calculation is entirely self-referencing.
- “Assay value” or “net peptide content” with a separate percentage means an external-standard or quantitative NMR method was used.
- Gradient conditions and column type confirm the method was appropriate for the hydrophobicity of the specific peptide.
- An attached chromatogram is essential. A COA without the underlying trace cannot be independently verified.
- A note about TFA (trifluoroacetic acid, a common salt used in synthesis) matters. If the peptide was not converted away from TFA, the gross weight of the powder includes significant non-peptide mass, which can make the apparent yield look higher than it is.
[PERSONAL EXPERIENCE] In practice, we always request the raw HPLC chromatogram PDF alongside any COA claiming purity above 98%. A clean baseline with a single dominant peak tells you far more than the headline percentage alone.
What area normalization and external standards each tell you about impurities
The two methods are also complementary when you need to understand what the impurities actually are, not just how much of the target peptide is present.
Area normalization is actually more useful for mapping the full impurity picture, because it puts all detected peaks on a common scale without needing a separate reference for each contaminant. You can see at a glance whether there are one or two small peaks or a scattered collection of fragments.
External-standard methods tell you the absolute amount of the target peptide but say nothing about individual contaminants unless you also inject a reference material for each one. A complete impurity analysis therefore typically combines area normalization (to see the relative distribution of everything present) with an external-standard assay (to pin down the absolute target content), plus mass spectrometry to confirm the identity of any major impurity peaks. This is the analytical approach described in impurity profiling of synthetic peptides.
Frequently asked questions about peptide purity HPLC methods
Can I directly compare area-normalized purity values from two different suppliers?
With caution, yes. If both suppliers use the same detection wavelength and similar gradient conditions, area-normalized figures are broadly comparable. But differences in column chemistry, gradient speed, and detector settings can shift peak areas by 0.5 to 1.5%, so comparisons only hold up if both suppliers disclose their chromatographic conditions and those conditions are similar.
Why is 98% area-normalized purity sometimes equivalent to a much lower net peptide content?
Area normalization only counts compounds that absorb UV light. Net peptide content accounts for everything in the vial by weight, including water, counter-ions (commonly TFA salts), and residual solvents. A sample reporting 98% area purity may deliver only 70 to 85% actual peptide by weight if TFA and water make up a substantial portion of the lyophilized powder. This is why simply weighing out a dose based on the area-purity figure can underestimate how much peptide is actually going into the experiment.
Does a higher purity percentage always mean better research outcomes?
Not automatically. The biological relevance of a contaminant depends on what it is and what experiment you are running. A peptide at 97% area normalization with well-characterized, biologically inert deletion fragments may be more fit for purpose than a 99% sample whose impurity profile is unknown. Knowing what the impurities are (confirmed by mass spectrometry) matters as much as the headline number for any structurally sensitive experiment.
What is the difference between area normalization at 214 nm vs. 220 nm for peptide purity HPLC area normalization?
Both wavelengths detect the same type of chemical bond in the peptide backbone, but 214 nm sits closer to the absorption maximum and gives a stronger signal. At 220 nm, the signal is slightly weaker but background noise from common HPLC solvents (acetonitrile, water, TFA) is also reduced, which improves the ability to detect small impurity peaks. Most peptide COAs use 214 nm. If a supplier reports 220 nm instead, the purity figures are still valid but not directly comparable to 214 nm measurements without a correction factor.
For research use only. Not for human consumption. All peptides available through Alpha Peptides are experimental compounds intended exclusively for laboratory and preclinical research. Explore the full catalog at alpha-peptides.com/shop/ and review Certificates of Analysis.