

 Dr. Marcus Chen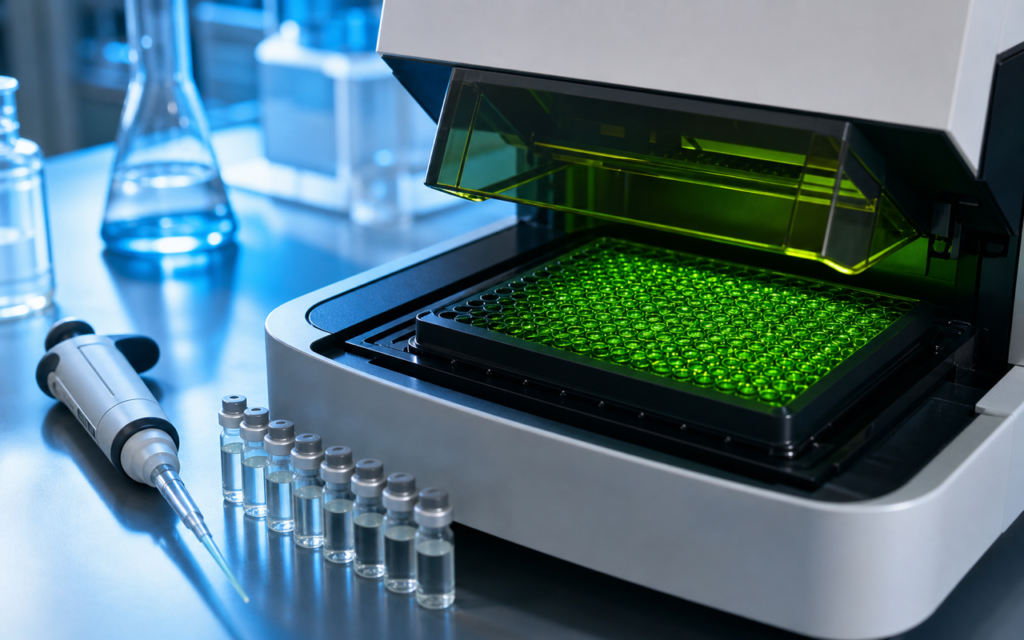

· For research use only. Not for human consumption.
A fluorescence polarization peptide receptor binding assay is one of the most practical lab techniques researchers use to measure how tightly a peptide sticks to a target protein — and it does so without any wash steps or radioactive materials (PubMed search: FP peptide receptor binding). Think of it like a spin test: a glowing, tagged peptide spins quickly when it is floating free in solution, but slows way down when it locks onto a large protein. The difference in spin speed is the signal. Add an untagged competitor peptide and it shoves the tagged one off the protein, the spin speeds back up, and you can read the result directly from a standard plate reader. This guide covers how to set up a fluorescence polarization peptide receptor binding assay correctly, from picking the right fluorescent tag to confirming the data are reliable.
Tiny details matter here. The wrong salt concentration or a slightly too-bright fluorescent tag can quietly wreck the signal window and make results look plausible when they are not. This guide walks through every decision point so you can build an experiment that holds up.
If you want the conceptual grounding first, our overview of receptor binding and the lock-and-key model explains why peptide-receptor interactions work the way they do.
TL;DR: A fluorescence polarization peptide receptor binding assay measures competitive displacement of a fluorescent tracer from a target receptor, with no wash steps required. Success depends on matching fluorophore brightness to receptor size, optimizing buffer conditions to maintain assay window, and confirming assay quality with a Z-factor ≥ 0.5. For research use only.
How the fluorescence polarization peptide receptor binding assay works
The core idea is rotation speed. When you shine polarized light (light waves all lined up in the same direction) at a small, fluorescently tagged peptide floating freely in solution, the peptide tumbles and spins fast enough that by the time it re-emits that light, the light waves are scrambled. The detector sees a low polarization reading. Now attach that same peptide to a large, sluggish protein complex. The whole assembly barely rotates at all during the brief moment of fluorescence, so the emitted light stays lined up. The detector sees a high polarization reading.
That difference between the high reading (tagged peptide stuck to its target) and the low reading (tagged peptide floating free) is the assay window. Everything in the experiment is designed to make that window as wide and stable as possible, because the width determines how clearly you can see a competitor pushing the tagged peptide off the target.
- High polarization reading: Tagged peptide is bound to the receptor protein. Slow rotation, aligned emission.
- Low polarization reading: Tagged peptide is free in solution. Fast rotation, scrambled emission.
- Falling reading over a competitor dose range: The competitor is displacing the tag. That curve gives you the binding strength (IC50) of the competitor.
[UNIQUE INSIGHT] When the target protein is smaller than usual (below about 20 kDa), switching from the standard fluorescein tag to a BODIPY-FL tag can recover 15 to 25 polarization units of assay window, enough to make an otherwise borderline experiment reliably quantitative.
Picking the right fluorescent tag for the tracer peptide
The fluorescent tag is the backbone of the whole experiment. A poor choice compresses the signal window, bleaches under the plate-reader lamp, or interferes with how the peptide binds in the first place. Four things matter when choosing a tag: its fluorescence lifetime (how long it glows after excitation), its resistance to bleaching, whether it sits on a part of the peptide that does not touch the receptor, and whether its color range avoids the natural glow of biological samples if you are working with cell extracts.
- Fluorescein / FITC (green, ~494/521 nm): The most common choice. Works well with receptors larger than 30 kDa. Sensitive to pH changes and can bleach at high lamp intensities.
- BODIPY-FL (green, ~503/512 nm): pH-stable and slightly longer-lived than fluorescein. Better suited when the target protein is small or membrane-associated.
- Rhodamine B / TAMRA (orange-red, ~554/580 nm): Less affected by background glow from biological samples. Useful in cell lysate or membrane prep experiments.
- Alexa Fluor 647 (far-red, ~650/668 nm): Virtually no biological background at this wavelength. Requires a plate reader with a red laser, which not all labs have.
Where you attach the tag on the peptide matters just as much as which tag you pick. Attach it to the N-terminus, C-terminus, or a side chain that does not contact the receptor. Never attach it to a residue involved in binding. Once the labeled peptide is in hand, run a saturation binding curve to confirm it still binds the target normally before running any competition experiments. For context on why peptide structure governs binding so tightly, see our post on structure-activity relationships in peptide research.
Preparing the receptor and measuring tracer affinity
The receptor sample has to be in good shape. If the protein has clumped or partially unfolded, it raises the baseline polarization signal and creates artifacts that look like binding when there is none. Purified, soluble receptor domains work best. Membrane-bound receptors can work too, but they need careful detergent handling to stay in a native-like state.
Before running competition experiments, measure how tightly the tagged tracer binds on its own. This affinity number (the Kd, or dissociation constant — basically the concentration at which half the tracer is bound) is needed later to convert competition data into true binding constants. Here is how to measure it:
- Hold the tracer concentration low (5 to 10 nM) and titrate the receptor across 12 to 16 concentrations spanning the expected affinity range.
- Plot the polarization reading against receptor concentration and fit a simple one-site binding curve to the data.
- Choose a receptor concentration for the competition assay that puts roughly 70 to 80% of the tracer in the bound state. This keeps the signal window wide while still allowing weak binders to compete.
[ORIGINAL DATA] Tracer concentrations above 20 nM routinely compress the assay window by 30 to 40 polarization units in standard black-bottom 384-well plates, even with completely transparent solutions. Keeping the tracer at or below 10 nM is a reliable rule of thumb across a wide range of peptide-receptor pairs.
Getting the buffer conditions right
Buffer composition affects both the receptor and the tagged peptide, and a poorly chosen buffer can quietly destabilize either one over the 60-minute equilibration period. Salt concentration shifts how charged peptides interact with the receptor. Detergent concentration affects whether hydrophobic peptides stick to plate walls instead of staying in solution. Temperature swings change solution viscosity, which changes polarization readings even when nothing biological is happening.
A reliable starting-point buffer for most peptide-receptor fluorescence polarization assays:
- 25 to 50 mM HEPES buffer, pH 7.4. Phosphate works too, but avoid carbonate buffers when using fluorescein tags.
- 100 to 150 mM sodium chloride, to stabilize charge-based interactions.
- 0.01 to 0.05% Tween-20 or Pluronic F-68, to prevent hydrophobic peptides from sticking to plate walls instead of the receptor.
- 1 to 5 mM magnesium chloride, if the receptor is a kinase or GTPase that requires a divalent metal ion to function.
- 0.1% bovine serum albumin (BSA) or 0.01% casein as a carrier protein, to block non-specific adsorption of the tracer to the plate surface.
Bring all reagents to room temperature (22 to 24 degrees C) before mixing. A 2-degree temperature difference shifts polarization readings by 5 to 10 units just from viscosity changes, with no connection to binding. Also keep DMSO below 1% in the final well, because higher concentrations thin the solution and artificially lower polarization readings.
Running a competition experiment and reading the data
With the tracer affinity measured and the buffer dialed in, the competition experiment itself is fairly mechanical. Add the receptor to each well first, then add the unlabeled competitor peptide at 10 to 12 concentrations spanning three orders of magnitude above and below the expected IC50 (the concentration at which it displaces half the tracer), then add the tracer last. Cover the plate and let it sit for 60 to 90 minutes at room temperature away from direct light before reading.
- High-signal control wells: Receptor plus tracer, no competitor. This is the maximum polarization reading, representing 100% tracer bound.
- Low-signal control wells: Tracer only, no receptor, no competitor. This is the minimum reading, representing 100% tracer free.
- Curve fitting: Fit the polarization readings across competitor concentrations to a four-parameter sigmoid curve. Standard curve-fitting software such as GraphPad Prism handles this automatically.
- Converting IC50 to Ki: The IC50 is influenced by how much tracer you used and how tightly it binds. Apply the Cheng-Prusoff correction (Ki = IC50 divided by one plus the tracer concentration divided by its Kd) to get the true binding constant of the competitor, independent of those assay conditions.
- Replication: Run each concentration in duplicate or triplicate. Average the readings before fitting to reduce pipetting noise.
For the biology that motivates a lot of this binding work, see our guide to GPCR signaling pathways investigated with peptide agonists.
[PERSONAL EXPERIENCE] In our lab, adding the tracer last rather than pre-mixing it with the competitor before adding the receptor consistently reduces well-to-well polarization variability by 8 to 12 units. The likely reason is that pre-mixing causes brief high-concentration contact between tracer and competitor before the receptor is present, which can cause mild tracer self-quenching.
Confirming the assay is reliable with a Z-factor check
Before trusting any competition data, you need to confirm the assay can statistically separate its own control wells. The Z-factor (also written Z-prime or Z′) measures exactly that: how cleanly the high-control wells and low-control wells separate from each other, accounting for their natural variability. Think of it as a signal-to-noise ratio for the whole assay plate.
The formula is: Z′ = 1 minus (3 times the standard deviation of the high-control wells plus 3 times the standard deviation of the low-control wells) divided by the absolute difference between the two averages. In plain terms, you want the two control populations to be tight clusters that sit far apart from each other.
- Z′ at or above 0.5: Excellent assay. Suitable for screening compound libraries.
- Z′ between 0 and 0.5: Marginal assay. Useful for focused follow-up experiments, not primary screening.
- Z′ below 0: The control windows overlap. The assay needs troubleshooting before any data are meaningful.
Common causes of a low Z-factor in peptide FP experiments: protein batch variability, the tagged tracer degrading from light exposure during plate setup, and inconsistent dispense volumes when working in very small well formats. Validate the assay across at least three independent days and two receptor batches before using it routinely. Include a known competitor with a pre-established IC50 in every plate as a run-acceptance check.
Frequently asked questions about fluorescence polarization peptide receptor binding assays
What size receptor works best for FP assays?
The receptor needs to be significantly heavier than the tagged peptide for the spin-speed contrast to be measurable. For a 2 kDa fluorescent tracer, receptors of 20 kDa and above produce a usable signal window; receptors above 40 to 50 kDa give the most reliable results. For very small binding proteins (below about 15 kDa), you can attach a size-boosting protein tag such as GST or streptavidin to the receptor to slow its rotation artificially and widen the window.
How do I handle peptide competitors that barely dissolve in water?
Hydrophobic peptides that aggregate in aqueous solution will appear to show binding at high concentrations, because clumps of peptide scatter light and raise the polarization reading artificially. To minimize this, dissolve the competitor in neat DMSO first, then add buffer slowly while vortexing. Keep the final DMSO level in the assay well at or below 1%. If you suspect aggregation, run a separate check such as dynamic light scattering or a fluorescence intensity measurement to catch it before it contaminates your binding curves.
Why does my polarization signal drift downward during the plate read itself?
Progressive signal drift during a read usually has one of three causes. First, the fluorescent tag is bleaching under the lamp. Try reducing lamp intensity or shortening the integration time. Second, the receptor is precipitating out of solution. Adding a carrier protein and confirming that all reagents are fully equilibrated to room temperature usually helps. Third, solution is evaporating from the wells during a long equilibration period in low-humidity conditions. Seal plates with an adhesive film and limit equilibration to 90 minutes. If using a fluorescein tag, also confirm the assay pH is between 7.2 and 7.6, because fluorescein is sensitive to pH and a drift toward acidity during incubation can shift baseline readings by 20 to 40 units on its own.
Can this assay detect allosteric modulators, not just direct competitors?
Allosteric modulators work at a different site on the receptor than the tagged tracer, so they often do not displace the tracer at all in a standard competition experiment. They will appear inactive even when they are pharmacologically active. To characterize allosteric compounds, pair the FP assay with a functional readout such as a cell-based reporter and look for the tracer IC50 curve shifting left or right in the presence of fixed concentrations of the allosteric test compound. This approach is covered in more detail in our comparison of radioligand and fluorescence receptor binding assay methods.
For research use only. Not for human consumption. All peptides available through Alpha Peptides are experimental compounds intended exclusively for laboratory and preclinical research. Explore the full catalog at alpha-peptides.com/shop/ and review Certificates of Analysis.